

Are you working on a technical project and could use some help? Is your data just not making sense and you'd love a second opinion? Does your code have you seeing stars? Join our virtual data hour and bring all of your tricky questions - we'll work through the answers...
Are you working on a technical project and could use some help? Is your data just not making sense and you'd love a second opinion? Does your code have you seeing stars? Join our virtual data hour and bring all of your tricky questions - we'll work through the answers together!
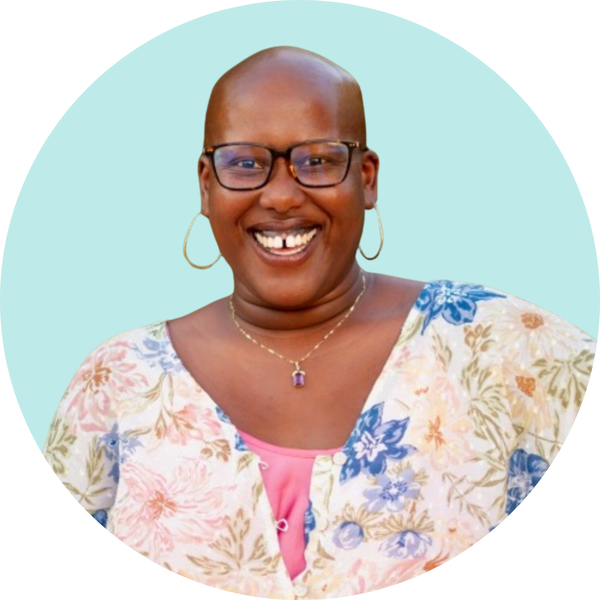
Barbara is a data analytics expert with a Bachelor's in Applied Statistics and a demonstrated history of working in the industry. She previously held a position as a Business Analyst at an insurance company where she primarily served the needs of the organization’s marketing department. She also worked for a statistician analyzing a variety of corporate, government, and nonprofit datasets. Barbara is currently the President of Boxplot Analytics, a consulting firm that produces accurate, data-driven results for corporate clients. She also teaches for General Assembly, and is an expert in Excel, Tableau, Qlik, Python, R, JavaScript, and SQL.
What are your recommended BI platforms for smaller businesses?
What approach you recommend to highlight your skills for a potential client when you don't know exact buzzword technology.
I produce documentation for a Data Analytics tool (similar to Tableau, but better!) and we are trying to prioritize documentation based on what users want to see. As an expert, what do you...
Considering when a wide audience (in terms of skill set, subject matter knowledge, etc.) is involved, how do you approach the level of complexity of visualized data? Visualization is a great tool,...
I have over 15 years experience in several major reporting, BI, and data viz tools as popularity and tech shifted every few years. Now it’s time to shift again. What is a modern elevator-pitch to...
Best practices for use of color in data visualization?
Do you have any advice on how to use data to help market an insurance company? Can you give an example of how you used one or more tools (Tableau, Qlik, Python, SQL, etc) at the insurance company...
Which are your favorite tools when compiling data for visual presentation? And why?
Do you have an established process when creating a dashboard? (e.g. specific order you like to do things in..)
What was the most impactful data story you have told?
How to identify which variables to consider when calculating the probability of a deal closing? Step-wise regression analysis? Teach me.
Is there a specific question you have for the speaker? Let us know!