Below is an article originally written by PowerToFly hiring partner S&P Global (Jodie Gunzberg, Beth Ann Bovino and Jason Gold) and can be found here. Go to S&P Global's Page on PowerToFly to learn more.
The global bull market in stocks has been long. Historic, even. Will it end? Sure, someday, just as all such runs do. But S&P Global has found an underutilized source of growth that could send global market valuations soaring—to the tune of an extra $5.87 trillion over the next decade. On the heels of our 2017 paper, The Key To Unlocking U.S. GDP Growth? Women, we decided to see what adding more women to the American workforce would mean for an aging bull market, in the U.S. and abroad. The results astounded us.
Key Takeaways
- Acceleration in U.S. GDP growth under increased female labor force participation could add a whopping $5.87 trillion to global market capitalization in 10 years.
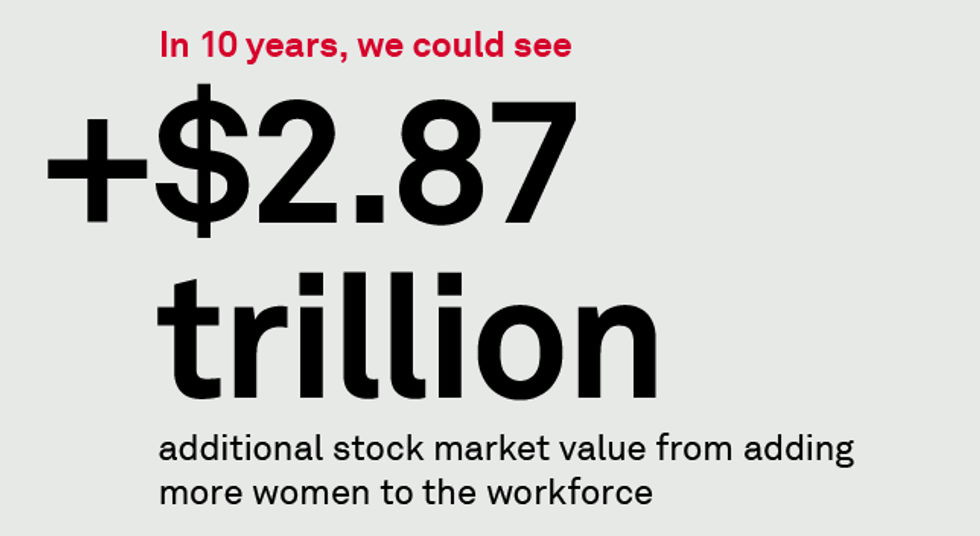
- For every 1% of GDP growth, the S&P 500 returns 3.4% on average annually. An additional 0.2 point of GDP growth would therefore boost the S&P 500 another 0.7%—and could increase U.S. market capitalization by $2.87 trillion in a decade.
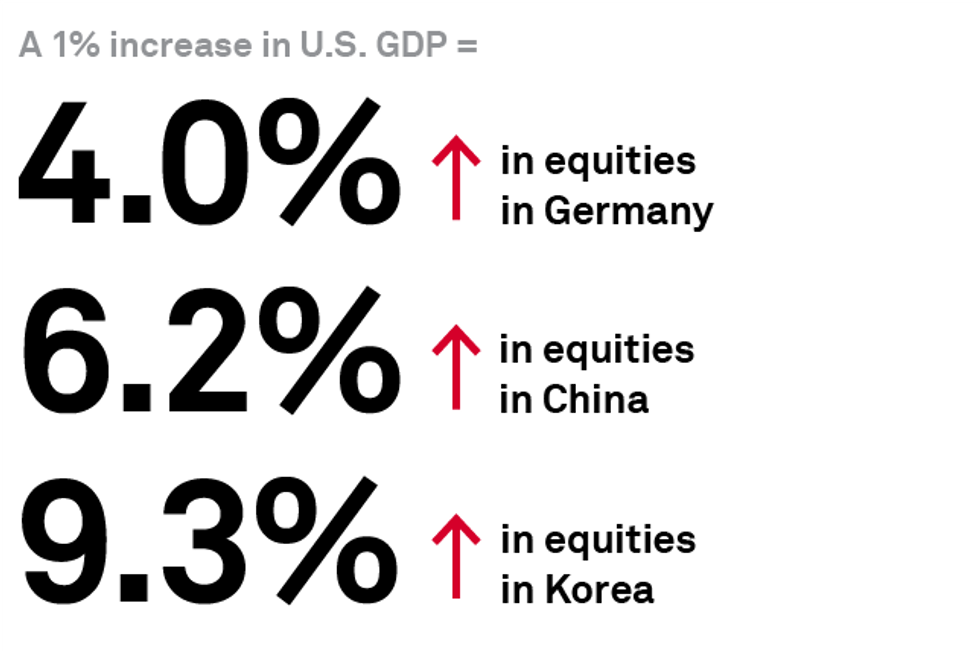
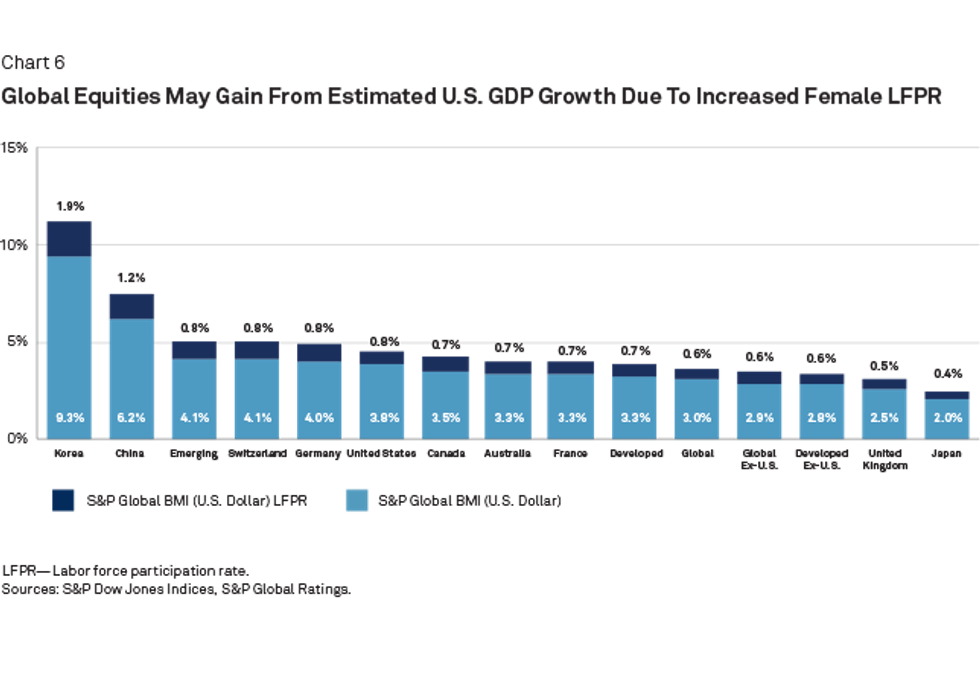
- Around the world, each additional percentage point of U.S. GDP growth has also translated into a 4% jump in equities in Germany, 6.2% in China, and a whopping 9.3% in Korea—even more than the gains we can expect in the U.S. itself.
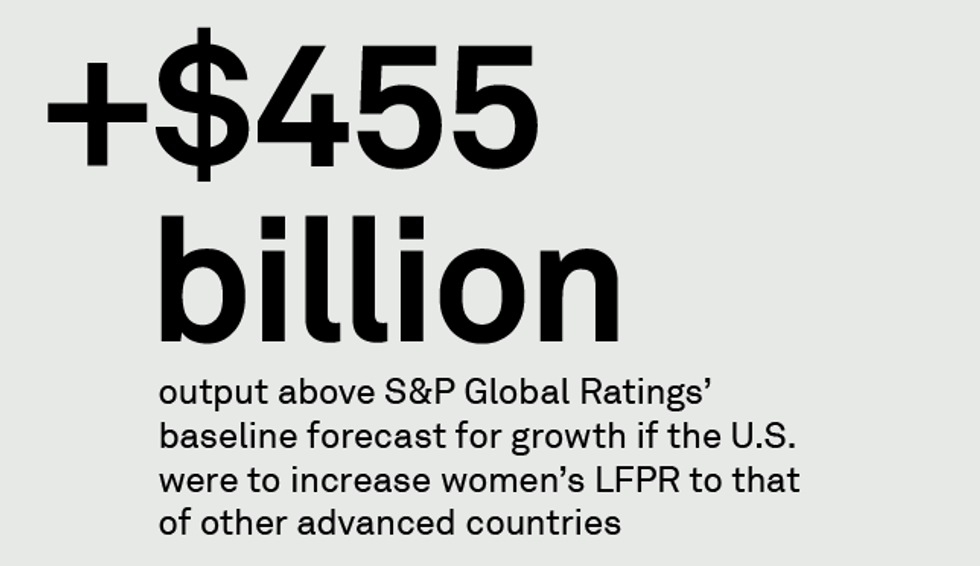
- An increase in women's participation to that of other advanced countries would add an average of 0.2 percentage point annually to U.S. GDP in the coming decade—or a cumulative $455 billion in output above S&P Global's baseline forecast.

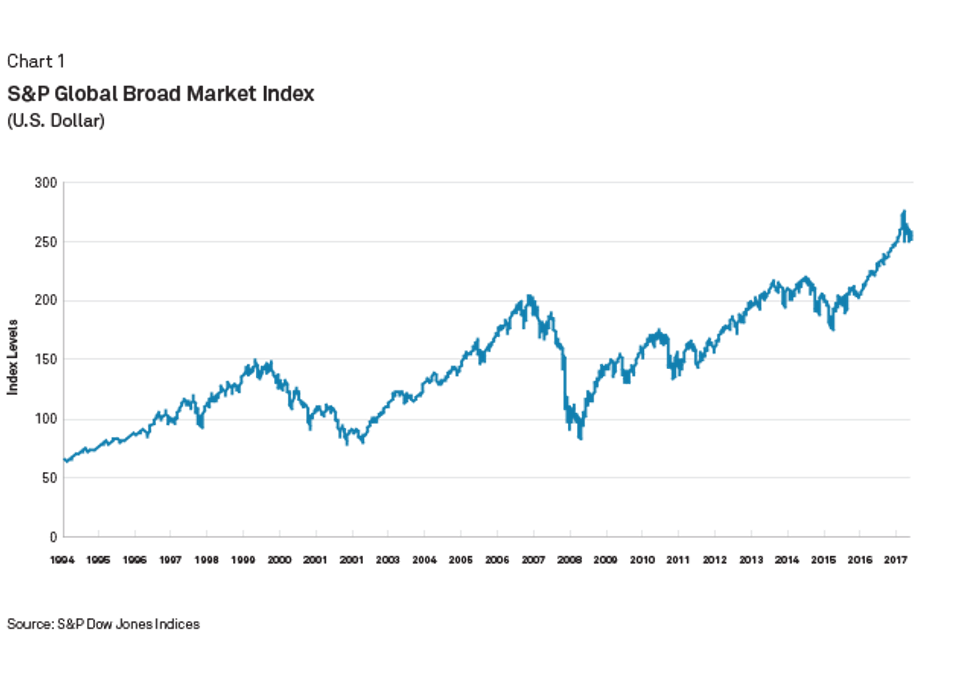
Beyond the benefits that additional workers—and, therefore, additional disposable income—would have on an economy so heavily reliant on consumer spending, we can draw an unswerving line from increased U.S. GDP growth to increased market value in not just the U.S. but in a number of other countries and regions. Specifically, based on the historical sensitivity of stock markets to economic expansion, an acceleration of U.S. output at the pace we calculate under increased female workforce participation could help extend a historically long global bull run in equities (see Chart 1), adding a whopping $5.87 trillion to global market capitalization in the next 10 years.
The U.S. is the most significant economy in the global market, making up more than half of the S&P Global Broad Market Index (BMI). Nearly 25% of U.S. equity market revenues come from overseas—mainly from the Asia-Pacific region and Europe.
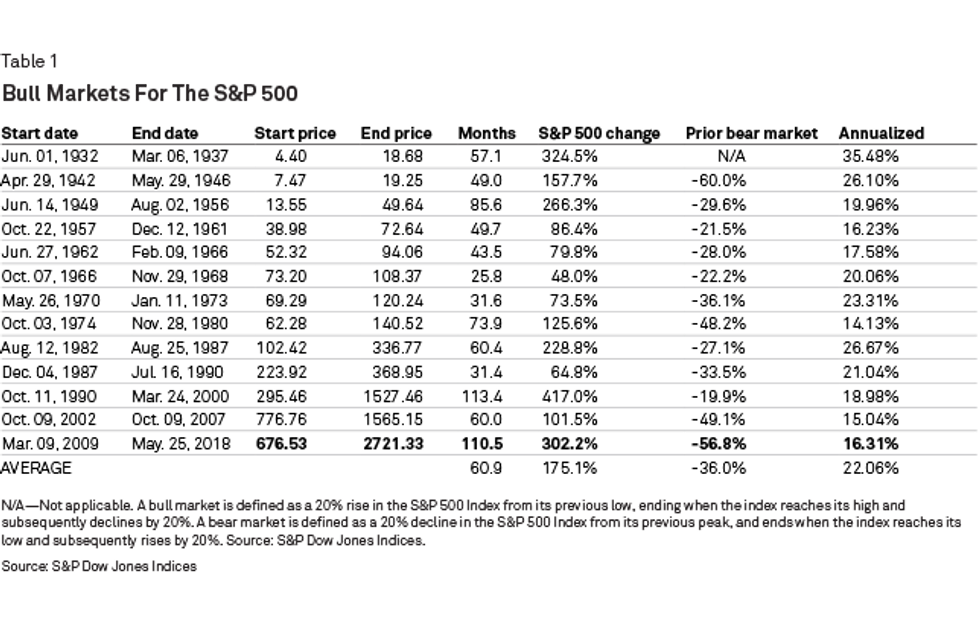
One way to measure the sensitivity of stocks to U.S. GDP growth is by using the "up-market capture ratio," which gauges the average historical annual stock market return per 1% of growth, and shows substantial gains from even a modest acceleration in the U.S. economic expansion. With the U.S. bull market embarking on its 10th year—and now the second-longest in history, just three months shy of the October 1990-March 2000 stretch (see Table 1)—an extra jolt could comfort those investors who are on the lookout for bearish signals.
While it's often said that bull markets (and expansionary periods) don't simply die of old age, among the signs that have historically augured market slumps are: fast-rising interest rates, slumping consumer confidence, and fear of recession.
The increasing likelihood that inflation will move up to the Federal Reserve's 2% target by the end of this year lends justification to S&P Global economists' forecast for four rate hikes this year as the central bank takes further steps along the path of monetary-policy normalization. U.S. equities markets seemed to buy into this view when a stronger-than-expected jobs report in late-January fueled investors' fears that borrowing costs would soon climb faster than expected. This kicked off a market correction (commonly defined as a 10% decline from recent highs), with the S&P 500 index dropping from its all-time high close of 2,872 on Jan. 26, to 2,581 on Feb. 8. (The benchmark index has recovered and was up 1.83% year-to-date through May 16.)
Since then, the yield on the 10-year Treasuries, an important benchmark for borrowing costs such as mortgage rates, recently topped 3% (albeit briefly) for the first time in four years—even as the yield gap between the two- and 10-year notes remains about as slim as it was before the Great Recession. This has led some market watchers to suggest the yield curve could soon invert. (While an inversion doesn't guarantee a recession, the past three economic downturns were preceded by a flip in yields on two- and 10-year notes.)
On another front, U.S. consumer confidence, while still strong, declined in March amid tempered optimism about the economic outlook. The Conference Board's measure of consumers' views on current and future economic conditions fell to 127.7, missing economists' expectations of 131—although, that comes after the index reached a record high in February.
Meanwhile, S&P Global expects U.S. real GDP growth of 2.9% this year and 2.6% in 2019, helped by a boost from the recent tax package and increased government spending. Additionally, our quantitative assessment of recession risk in the next 12 months is less than 10%, and our qualitative assessment, which recognizes hard-to-measure policy mistakes, remains at 10%-15%. While few economists see a recession on the near-term horizon, it's important to note that, as a leading indicator, the stock market typically slides before the onset of an economic slump, rather than the other way around. In fact, bear markets have historically preceded recession (defined as consecutive quarters of contraction) by more than half a year, according to investment research firm CFRA.
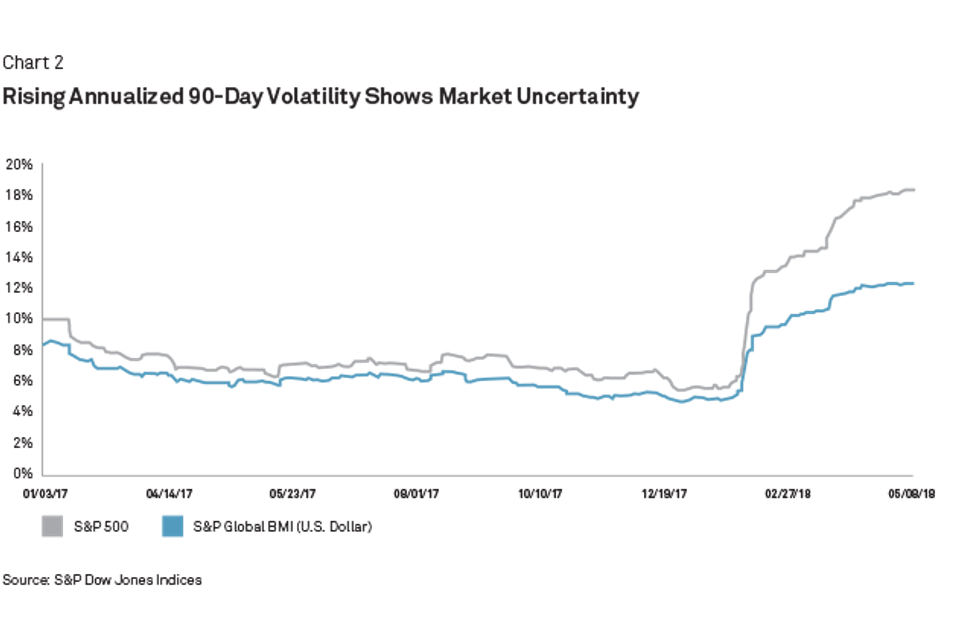
Fear of recession is difficult to measure, but there has been a dramatic increase in stock market volatility, reflecting uncertainty—or higher risk. The current annualized 90-day volatility of the S&P 500 is 18.4%, and it's 12.4% for S&P Global BMI (see Chart 2). That's a respective 1.8 and 1.5 times higher than the levels at President Trump's inauguration. Current volatility is also 3.4 (U.S.) and 2.6 (global) times higher than the lows at the end of 2017.
Why Women Are the World's Secret Weapon
Against this backdrop, S&P Global believes an increase in the female labor force participation rate (LFPR) in the U.S. can help.
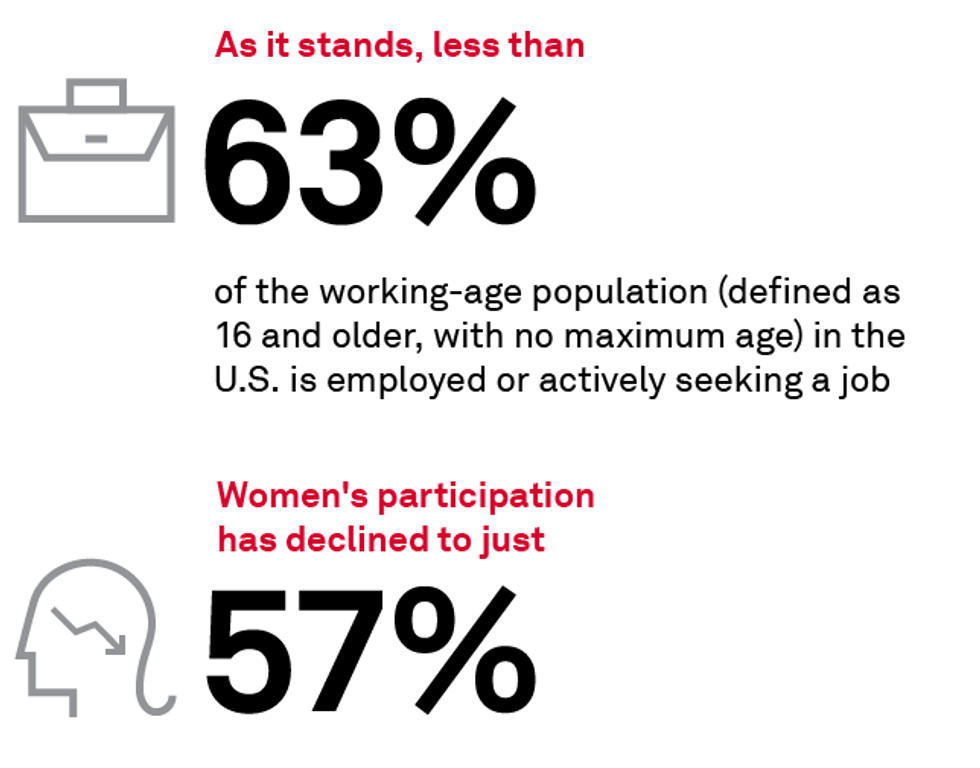
As it stands, less than 63% of the working-age population (defined as 16 and older, with no maximum age) in the U.S. is employed or actively seeking a job—hovering near the lowest level in more than four decades. For years, the surge of women entering the workforce largely offset the slow attrition of male labor force participation. But since the turn of the millennium, women's participation has also declined, to just 57%, from roughly 60% in 2000, according to the Bureau of Labor Statistics.
True, having nearly three in every five U.S. women in the workforce is nearly double the rate of the years immediately following World War II (when many working women left to make way for returning soldiers). But it compares unfavorably to the strong gains of the 1960s-1990s, when such things as advances in household-appliance technology, the advent of the birth-control pill, and (perhaps most importantly) evolving attitudes about societal roles gave women greater freedom to work outside the home.
And it wasn't that long ago that the U.S. was among the global leaders in women's workforce participation. As recently as 1990, LFPR among prime-age American women was near the top of advanced economies in the Organisation for Economic Co-operation and Development (OECD). In 1990, LFPR for women of prime working age in the U.S. reached 74%. Since then, that rate has stayed roughly stable while increasing steadily elsewhere, pushing the U.S. down to 20th place among 22 advanced OECD economies by 2016.
So, why the focus on women and not some other cohort of workers?
In the U.S., the biggest obstacle women must hurdle to fully engage in the labor force involves children—in large part because the U.S. is the only country in the OECD that doesn't provide income support during maternity or parental leave by law. Moreover, a 2012 OECD report showed that full-day care for an infant eats up 41% of single mothers' median income, and a 2013 survey by the Pew Research Center found that 39% of mothers had, at some point in their careers, taken off a significant amount of time to care for a child or other family member. More than 25% had quit work entirely to do so; just 24% of fathers had taken a significant amount of time off to assume these responsibilities.
These trends take on greater importance when we consider that the median age of baby boomers is now 63. This means that more than 74 million people are at, or approaching, a time when old age goes from some far-off future state to a day-to-day reality. And, as we've seen, the responsibilities of elder care are out of balance from a gender perspective.
This holds true not just for the U.S., but in many other advanced economies—and is particularly important as the aging of societies as a whole adds to their economic burdens. According to a 2014 report from the Pew Research Center, the "old-age dependency ratio"—that is, the number of people 65 and older per 100 people of working age (15-64)—is rising around the world, particularly in Northeast Asia and Europe. The report suggests that by the middle of this century, the old-age dependency ratio in South Korea, for example, could soar as much as 51 percentage points from 2010, to 66. In other words, for every three working-age Koreans, there will be two in old age. Similarly, Spain's old-age dependency ratio may jump 42 percentage points, to 67, and Italy's may rise 31 points, to 62.
How To Possibly Add $2.87 Trillion To U.S. Market Value
S&P Global believes that a concerted effort to increase participation and foster retention of women in the American workforce, particularly in those professions traditionally filled by men, represents a substantial opportunity for growth of the world's principal economy. (See "The Key To Unlocking U.S. GDP Growth? Women," published Dec. 5, 2017.)
We calculate that if the U.S. were to increase women's LFPR to that of other advanced countries, it would add an average of 0.2 percentage point annually to GDP in the coming decade—which translates to a cumulative $455 billion in output above S&P Global's baseline forecast for growth. Even for an economy now exceeding $20 trillion, an extra few hundred billion dollars goes a long way.
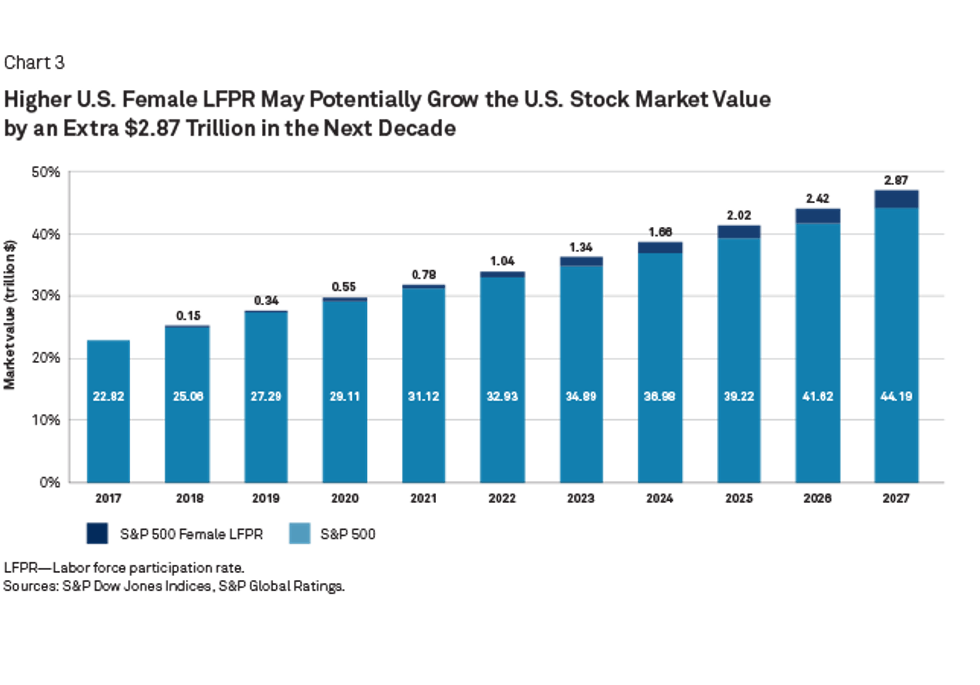
Similar to the way the returns on increased government infrastructure spending, for example, can exceed the investment through the so-called "multiplier effect," a boost to annual GDP of 0.2 percentage point would typically translate to even greater gains in equities. In fact, for every 1% of growth in GDP, the S&P 500 returned 3.4% on average annually, from 1990. An additional 0.2 point a year of GDP growth would therefore boost the S&P 500 an additional 0.7%. All else being equal, the additional estimated economic expansion would increase U.S. stock market capitalization by $2.87 trillion in a decade (see Chart 3).
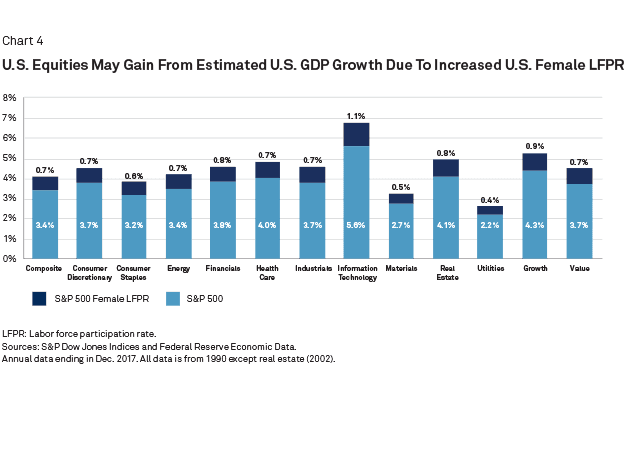
In the U.S., the technology sector might be the biggest beneficiary of this extra jolt, given that it has the highest up-market capture ratio, at 5.6% per percentage point of GDP growth. An additional 0.2 point of growth could therefore add 1.1% to tech shares. At the other end of the spectrum, the sensitivity of utilities stocks to GDP growth is just 2.2-to-1, and so an extra 0.2 point of growth would add just 0.4% to shares in this sector (see Chart 4.)
Given stocks' sensitivity to economic expansion, it makes sense that accelerated growth in the U.S. would boost equities around the world—especially when we consider that the U.S. accounts for slightly more than half of the global equities market capitalization of $54.8 trillion. Still, the "multiplier" effect that U.S. growth has on specific countries' stock markets is, in some cases, surprisingly large.
The mechanism for this is fairly simple: Because the U.S.'s "trade elasticity" is such that the country's imports tend to increase at a faster pace than GDP growth during expansionary periods (while shrinking at closer to a 1-to-1 rate during times of economic contraction), manufacturers and other exporters to the U.S. enjoy outsized benefits when the American economy expands.
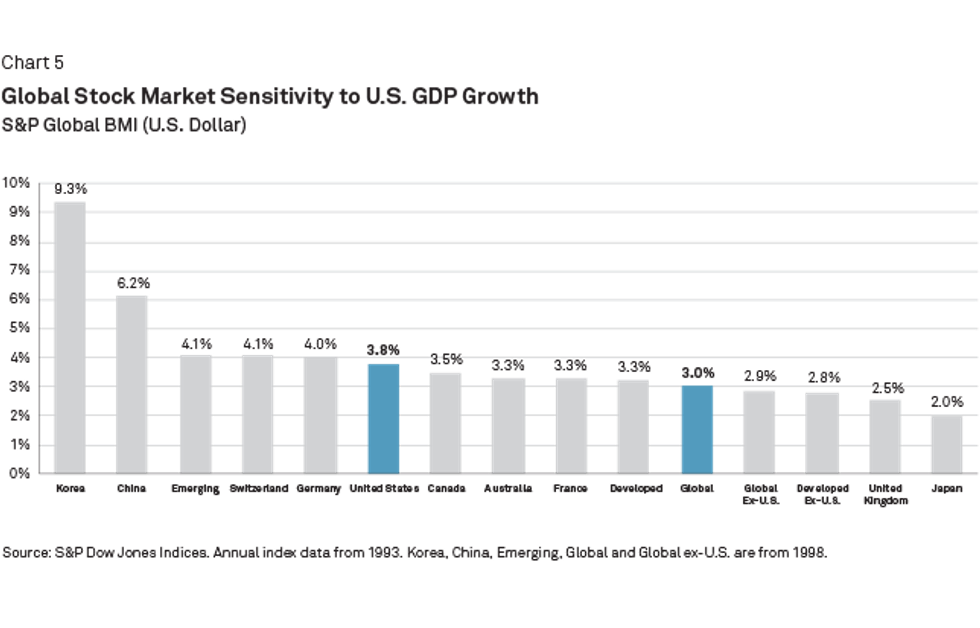
S&P Dow Jones Indices calculates that, for example, each additional percentage point of U.S. GDP growth has translated to a 4% jump in equities in Germany, 6.2% in China, and a whopping 9.3% in Korea—even more than the gains we can expect in the U.S. itself (see Chart 5).
When we add in the boost to U.S. GDP of increased women's LFPR, the numbers become even more impressive. Equities in Korea would enjoy an additional 1.9% bump, and those in China would gain another 1.2% (see Chart 6).
The notable difference in the up-market capture ratios of, for example, China and Japan—the Nos. 1 and 4 U.S. trade partners among single countries—can be explained in part by the amount of trade the countries conduct with the U.S. relative to the size of their trade surpluses with the U.S. and their annual output, as well as where the countries rank in total market capitalization.
In dollar terms, China exports almost four times as much to the U.S. as it imports in American goods and services, with exports to the U.S. accounting for 4.2% of the Chinese economy. For Japan, exports to the U.S. are roughly only twice its American imports, and exports to the U.S. account for just 2.8% of Japanese economic output.
Further evidence that this dynamic is at least partly responsible for the disparity includes the fact that South Korea—the U.S.'s sixth-biggest trade partner and No. 11 on the list of national economies—sends just about a third more to the U.S. than it receives, but those goods and services make up a substantial 4.6% of Korea's GDP.
Meanwhile, Japan's market cap, at $4.92 trillion, puts it at No. 2 in single-country rankings (although a distant second behind the U.S.'s $27.7 trillion). The dollar value of stocks traded in Japan is also roughly equal to the size of the country's economy, which is the world's third-largest. On the other hand, China's market cap, at $1.88 trillion, is much smaller than its island neighbor's and is less than one-sixth the size of the country's $12 trillion economy.
The Potential to Create an 'Extra' $5.87 Trillion in Market Value
Things get even more interesting when we consider the dollar values that could accumulate to various countries' market capitalizations. Most notably, Korea, which currently has the smallest market value of the countries in our forecast, could benefit so extraordinarily from U.S. GDP enhanced by increased female LFPR that it would jump to No. 3, just behind Japan and the U.S. in the 10 years we examine (see Table 2).
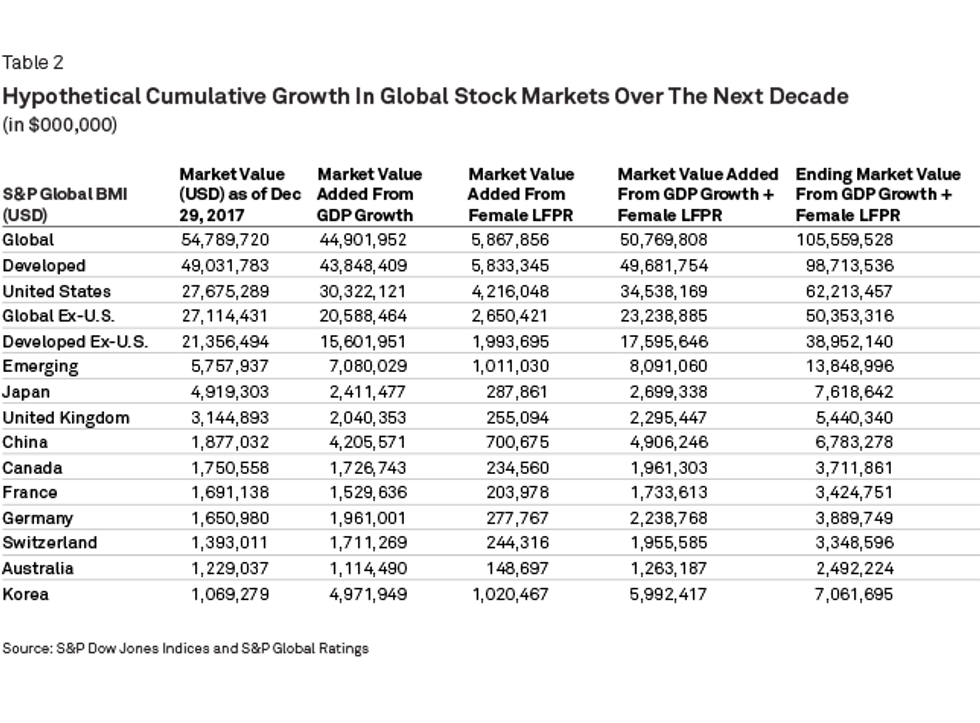
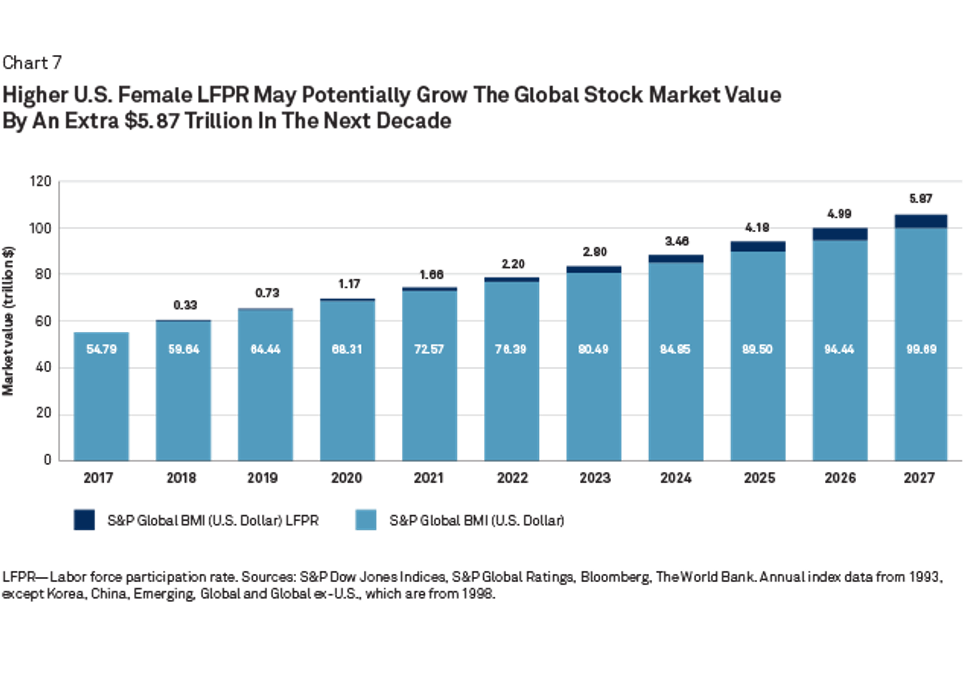
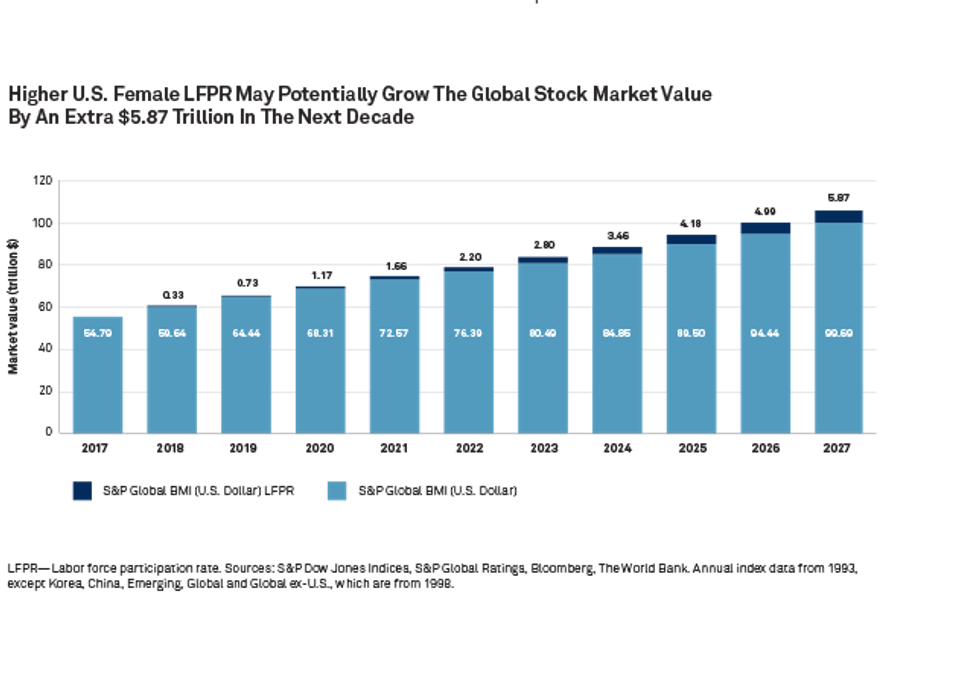
In total, global market cap could surge by $5.87 trillion in a decade given an acceleration in U.S. GDP growth at the pace we calculate under increased female workforce participation (see Chart 7).
All told, if the U.S. were to follow the lead of many other developed countries and implement policies that encourage women to enter and remain in the workforce, the effects could reverberate globally, supporting a stock market boom far greater than the economic growth itself. Given the sensitivity of historical stock market returns to U.S. GDP growth, the result of adding more women to the workforce could boost U.S. stock market value by an additional return of 0.7% annually in the next decade, translating into an extra $2.87 trillion of market value. What is perhaps more impressive is the sprawling power that U.S. growth has globally, with an incremental return of 0.6% to the global stock market translating into $5.87 trillion of added market value.